Hi Friends,
My cousin’s were discussing what to watch in Netflix on last weekends, Which triggered me this idea to analyze Netflix for anybody with just few click to download data and analyze in Power BI.
YES Wait! Before you search how to get Netflix data just read following steps, I am going to explain how to get your Netflix data and you can analyze your downloaded data in Power BI.
You can achieve this three steps
Step 1 – Get Netflix Data
Step 2 – Get Power BI Desktop.
Step 3 – Get my Netflix Power BI Template and Analyze
Step 1 – Get Netflix Data
In this step we will learn how to Download your Netflix Data for Netflix website.
Click on link – https://www.netflix.com/viewingactivity
When you click on “Download all”, will download CSV file on your computer with file name – NetflixViewingHistory.CSV
I know you will be curious to see data, Go ahead and open file it will have only two column, Do not change heading column as Power BI template is dependent on this heading !
Title and Date which is actually Last Date on which you watched given title
Step 2 – Get Power BI Desktop, If you already know what is Power BI please skip this step and jump to Step 3.
To download Power BI click on link – http://bit.do/pbidownload, Install software.
You can follow installation instruction from this link – https://docs.microsoft.com/en-us/power-bi/desktop-get-the-desktop
Step 3 – Download Power BI template – http://bit.do/pbinetflix
Click on link to download Power BI template from Microsoft gallery
Downloaded Power BI template should look like this
Click to open this file
As soon as you open Power BI template file it will prompt to input CSV file you downloaded using step 1
Click on Load, Let Power BI load CSV file
That’s IT ! you are ready to analyze your Netflix Data.
How to use this Netflix dashboard-
This is chart will keep track of all your filters
For example if I will search, My wife’s favorite season in search Box – “Heartland”
It will show Heartland has 9 Series of season and 158 Episode
Season analysis chart will give you more details about season
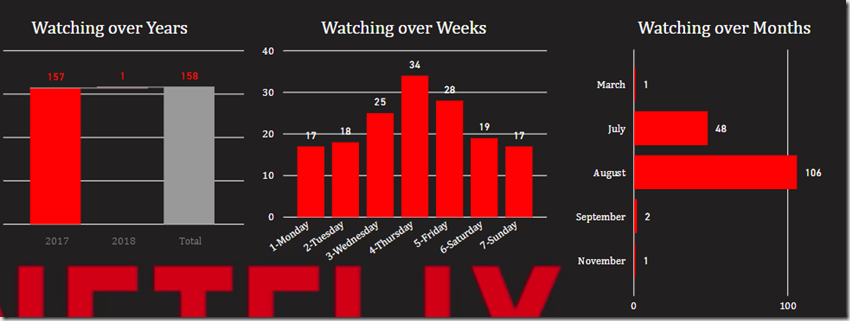
On top you will find all date demographics, Which will show how you watch those episode
You can search for on movies or for specific year by just clicking on following table
If you want know which day you watch most click on sort button on this chart
What is PBIT file – A PBIT file is a template created by Power BI Desktop, a Microsoft application used to create reports and visualizations. It contains queries, visualization settings, data models, reports, and other data added by the user.
Few points you should know regarding Netflix data –
- This is view history analysis, Netflix does not give you each activity of your watched, for example if you watch any episode twice you will get only one stats for this with last watched date.
- Data will not refresh from Netflix, You have to download your own data, But you can download any time new file and provide new input to power BI template.


